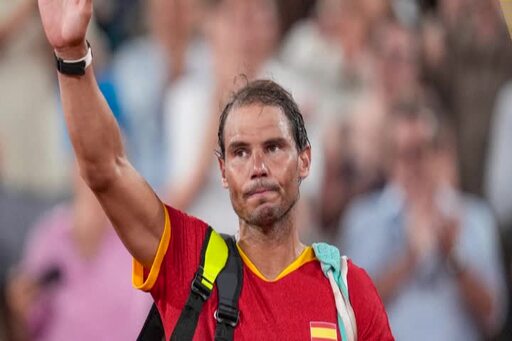
|
Preview: Kansas vs Memphis (St. Louis, MO) |
|
|
|
Nov 17, 2009 |
Kansas vs Memphis (St. Louis, MO)| | Kansas | Memphis
| Performance Indicators
| | | | Record | 1-0 | 1-0 | | AP Rank | 1 | NR
| Pomeroy Rating (Updated daily) | 3 (too early to matter)
| 41 (too early to matter)
| Consensus Ranking (Updated periodically - avg several computer ratings and polls) | 1 (reflects many computer polls that don't have enough data yet)
| 13 (reflects many computer polls that don't have enough data yet)
| Best opponents defeated this season (Ranking from Pomeroy) | vs Hofstra (#122) W 101-65 | vs Jackson State (#269) W 82-53 | RPI (Used for schedule strength, not team strength. Current and forecast RPI from RPIForecast .) | Current: 111 Forecast: 1 (too early to matter) | Current: 150 Forecast: 5 (too early to matter) | Prediction Models | | | | Vegas Oddsmakers | Win by 12 Est. Projection: TBD
| | Prediction Tracker (Average of several power ratings) | Win by 3.5 (not enough data) | | | Sagarin Power Ratings (Predictor) | Win by 1.0 (not enough data)
| | Pomeroy (Efficiency and Tempo-Adjusted) | Win by 102-81 (No % chance of victory supplied) (not enough data) | | TeamRankings.com
(Use home rating for home team, road for road. If fewer than 3 games played at corresponding locations, use "predictive" ratings for both teams but use specific home advantage rather than standard average homecourt advantage for all NCAA teams.) | | Win by 0.3 (not enough data)
|
PSAN-Related Player Ratings - Cumulative This Season(PSAN-O = Offensive impact, PSAN-D = Defensive impact. For PSAN-D, lower ratings are better. PSAN70 ratings are just PSAN expressed as "per 70 possessions" to reflect efficiency. The difference between ePSAN and PSAN is that "e" is enhanced and weighs recent games more - used for Kansas only.) Kansas Impact Ratings
| PLAYER | ePSAN-O | ePSAN-D | ePSAN-Comp | | Xavier Henry | 12.09 | -0.53 | 12.61 | | Cole Aldrich | 4.62 | -2.22 | 6.84 | | Sherron Collins | 6.16 | 0.73 | 5.43 | | Markieff Morris | 3.27 | -1.58 | 4.85 | | Marcus Morris | 4.21 | -0.60 | 4.81 | | Elijah Johnson | 3.87 | 0.18 | 3.69 | | Tyshawn Taylor | 2.76 | -0.73 | 3.49 | | Tyrel Reed | -0.41 | -1.21 | 0.80 | | Chase Buford* | 0.88 | 0.25 | 0.63 | | Conner Teahan | -0.24 | -0.47 | 0.23 | | Jordan Juenemann* | -0.69 | 0.00 | -0.69 | | Thomas Robinson | -3.48 | -0.66 | -2.82 | Efficiency Ratings
| PLAYER | ePSAN70-O | ePSAN70-D | ePSAN70-Comp | | Xavier Henry | 17.93 | -0.78 | 18.71 | | Markieff Morris | 9.69 | -4.69 | 14.38 | | Cole Aldrich | 6.85 | -3.29 | 10.14 | | Marcus Morris | 6.81 | -0.97 | 7.78 | | Elijah Johnson | 8.10 | 0.37 | 7.73 | | Sherron Collins | 7.56 | 0.90 | 6.66 | | Chase Buford* | 7.84 | 2.24 | 5.60 | | Tyshawn Taylor | 3.93 | -1.04 | 4.97 | | Tyrel Reed | -0.98 | -2.87 | 1.89 | | Conner Teahan | -1.07 | -2.10 | 1.03 | | Thomas Robinson | -7.29 | -1.39 | -5.90 | | Jordan Juenemann* | -8.24 | 0.00 | -8.24 | * Rating not based on enough data. | Memphis Impact Ratings | PLAYER | PSAN-O | PSAN-D | PSAN-Comp | | Will Coleman | 5.47 | -2.56 | 8.03 | | Drew Barham* | 3.07 | -0.07 | 3.13 | | Roburt Sallie | -1.51 | -2.54 | 1.03 | | Doneal Mack | 2.14 | 1.15 | 0.98 | | Wesley Witherspoon | 0.50 | -0.46 | 0.96 | | Elliot Williams | 0.09 | -0.57 | 0.66 | | Malik Thomas* | 0.00 | -0.61 | 0.61 | | Aaron Jacques* | 0.53 | 0.00 | 0.53 | | Charles Holt* | 0.00 | 0.00 | 0.00 | | Willie Kemp | -1.16 | -1.01 | -0.15 | | Preston Laird* | -0.60 | 0.00 | -0.60 | | Tyler Foster* | -0.66 | 0.00 | -0.66 | | Pierre Henderson-Niles | -1.83 | -0.55 | -1.29 | | D.J. Stephens* | -1.50 | -0.07 | -1 | Efficiency Ratings | PLAYER | PSAN70-O | PSAN70-D | PSAN70-Comp | | Malik Thomas* | 0.00 | -24.64 | 24.64 | | Aaron Jacques* | 21.30 | 0.00 | 21.30 | | Drew Barham* | 20.62 | -0.44 | 21.06 | | Will Coleman | 10.51 | -4.92 | 15.43 | | Doneal Mack | 4.31 | 2.32 | 1.99 | | Wesley Witherspoon | 1.00 | -0.94 | 1.94 | | Roburt Sallie | -1.79 | -3.02 | 1.22 | | Elliot Williams | 0.11 | -0.70 | 0.81 | | Charles Holt* | 0.00 | 0.00 | 0.00 | | Willie Kemp | -1.42 | -1.23 | -0.19 | | Pierre Henderson-Niles | -4.10 | -1.22 | -2.88 | | D.J. Stephens* | -6.73 | -0.29 | -6.44 | | Preston Laird* | -12.19 | 0.00 | -12.19 | | Tyler Foster* | -26.62 | 0.00 | -26.62 | * Rating not based on enough data. |
Opponent Four Factor Analysis
Based on the cumulative season boxscore for the opponent, we can look at the Four Factors to see where the team has derived the bulk of its (dis)advantage in terms of scoring margin versus its opponents to date. Here is the breakdown for KU's opponent this game: | | Memphis
| Opp | Advantage | | | eFG% | 50.98% | 40.35% | 11.5 | | | TO Rate | 18.73% | 28.81% | 6.8 | | | OREB% | 44.12% | 33.33% | 3.9 | | | FTA/FGA | 58.82% | 12.28% | 2.6 | FT Pct | | | | | 20.4 | FT Attempts | ANALYSIS: This is based on only one game. The Tigers' biggest advantage came in freethrow attempts, which was also a huge strength in KU's first game. Though Memphis shot considerably better than Jackson St., the advantage was not nearly the same as the one the Jayhawks enjoyed (60-40%). Statistical Strengths and Weaknesses Analysis(Note: These are based on raw statistics that are unadjusted for strength of opposition.) | ** Denotes that team with advantage also ranks in Top 50 in that category | | Clear Advantage for Kansas | No Clear Advantage | Clear Advantage for Memphis | | Memphis % own 2FGA's blocked** | | | | Kansas OREB** | | | | Memphis FT% | | | | | Memphis 3pt FG% | | | Memphis eFG%** | | | | | Kansas 3pt FG% | | | | Kansas PTS/Poss | | | | Memphis 2pt FG% | | | | Kansas eFG% | | | | Kansas FT Rate | | | | Kansas 2pt FG% | | | | Memphis PTS/Poss | | | | Memphis % Poss STL by Opp | | | | Kansas TO rate | | | | Memphis FT Rate | | | | Memphis TO rate | | | | | Memphis OREB** | | | | Kansas % Poss STL by Opp** | | | | Kansas FT%** | | | | Kansas % own 2FGA's blocked | ************************************************************* | Memphis will have above avg % of FG's assisted | | Kansas plays faster tempo than Memphis | |
Projection Summary | | Projection | Comments | OVERALL RESULTS | | Final Score | KU 85-67
| This early in the season, the adjusted tempos in Pomeroy are very unreliable. Here, I plugged in last season's adjusted tempos for each team but kept the projected efficiencies (because those are adjusted for being so early in the season as well). | Tempo (# poss)
| 67 | | FOUR FACTORS ADVANTAGES
| | eFG% | KU 52-43% | | | TO Rate (lo better) | UM 20-19% |
| | O-Reb% | KU 55-46%
| Wow, anyone care to rebound on the defensive side?
| | FT Rate | UM 42-40%
| Wow, anyone care to defend without fouling? | Four Factors Overall
| Skewed projections based on too little data, but perhaps a chance that KU's better shooting is the main difference here. Hard to believe the OREB% will come true.
|
|
Sports and Numbers ProjectionKansas wins 85-67(some prediction models not included yet) | |